Predicting elections with posters
Can you predict elections based on how the posters people display change? I try an experiment.
19 May 2026
Here’s a game to play that is fun for all the family and great for your mental health. During an election period, go around your local town, village, or other place where people happen to live, and count the number of placards displayed outside people’s houses in support of each political party. It involves some of everyone’s favourite activities: counting and politics. You cannot not have fun. I have done this at the last few local elections now, and at this last set of local elections gave me a mathematically dubious idea - predict elections based on how people’s publicly displayed political affiliations switch.
This type of calculation is known as Swing, a measurement in the change of voting intention between elections, and is used in sophology to predict outcomes of elections, most notably in the UK’s General Election Exit Polls that have predicted outcomes with remarkable reliability.
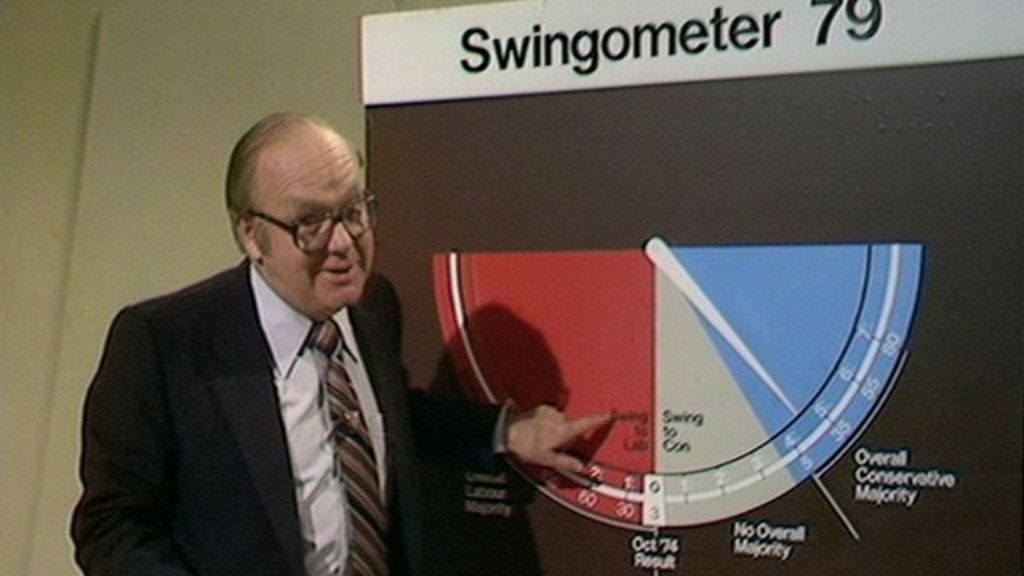 The BBC Exit Poll Swingometer (1979)
Exit Polling is generally reliable (with exceptions) as voters coming out of polling stations are asked to fill in a mock ballot paper identical to the real one they just filled in.
The idea to measure expected swing based on public placards cannot be expected to be as accurate.
Why? Because those that display placards outside their houses are a small minority - this is a small sample size leading to a high margin of error, extenuated by how my data is limited to the ones I found it convenient to count. They are biased towards those parties able to mobilise activists and encourage them to display material, typically biasing in favour of left-wing progressive parties.
Nethertheless, I believe such data can still be useful - if people displaying placards change their affiliation and between parties that stand to win then this does reflect a meaningful change in voting intention. Placards are biased towards left-wing progressive parties, so where affiliations are potentially switching between such parties this is a very useful indicator indeed.
This was particuarly the case in the 2026 Local Elections with Labour voters swinging to the Green party. And it was particuarly the case in Cambridge where I have been collecting counts of placards at elections. Useful.
The data
The counts I have collected compare placards counted at the 2022 Cambridge City Council elections with those for 2026.
My count in 2022 was as follows:
10 Labour (55.56%)
6 Liberal Democrat
2 Green (11.11%)
And my count in 2026 was as follows:
10 Liberal Democrat
8 Green (33.33%, +22.22%)
6 Labour (25.00%, -30.56%)
And to calculate predicted swing:
0.5 * (22.22 + 30.56) = 26.39%
To note these are small sample sizes which vary on the number of placards surveyed. But it predicts a 26.39% swing from Labour to Green for this dataset.
Was this prediction accurate?
The real result
No.
The real swing was 17.1% between the 2022 and 2026 Cambridge City Council Elections.
But…
… If I worked for YouGov that would satisfy them as some of their margins of error are also ridiculous, perhaps an error of 9.3% isn’t bad, esspecially for a sample size of 18.
So with a higher sample size there is potential for predicting elections in this way, with these sort of Left vs Left contests.